- General
-
 Questions

Terrible performance in deferred
Not sure if this is a lighting issue, I disabled shadows to try and rule that out. If I take your gaia demo fast scene, change the camera and manager cam setting to deferred, on low quality I go from 14 drawcalls to over 2000 (I disabled everything but trees to get just the numbers for them).
Same results in my own scenes.
Answer

Transitioning billboards (those billboards that are closer to the camera, doing their transition) can each create a draw call.But distant billboards (those far enough away that they aren't transitioning anymore) should only create a single draw call. How far away are you from the billboards in this test? I think you can submit screenshots through this userecho, you might post some screenshots. I'm not aware of there being any difference in draw calls between deferred and forward. Also, you might see better results though in the regular demo scene (not the "fast" one).
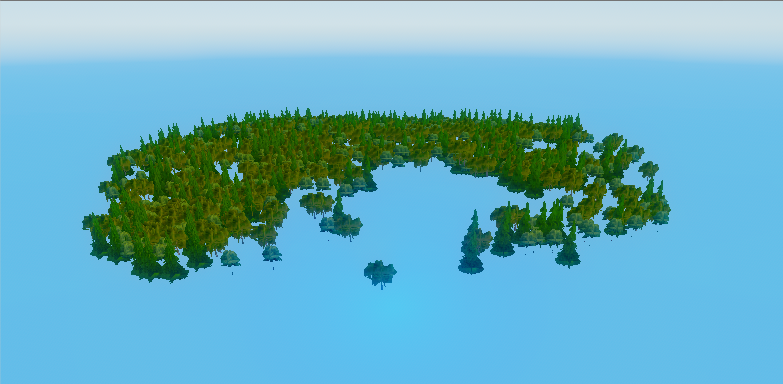
I'm very far away and LOD cranked all the way down, it's just billboards rendering. You should be able to replicate this easily by just switching unity to deferred and then updating the demo scene camera and manager to deferred. Then clicking best performance button in demo. The difference is obvious regardless of settings or where the camera is, it'st that big.
This is the scene with everything but trees disabled. 955 trees. LOD and billboard quality at lowest. 1826 draw calls 997 batches. Disable the tree root object and goes down to 41 draw calls.
The regular Gaia Demo does the same thing for me. Switch cam/manager to deferred and draw calls jump.
strange. So if I set billboard setting to billboards only, something goes wrong and it shows both, shoots draw calls through the roof it hit 11k lol.
I haven't updated the trees for unity 2017 and I assume that's the problem here, they may have changed something about how batching works in deferred. I'll look into it right away.
I'm assuming it's fixable so I'll just keep an eye out. When it's working correctly it's great, just what I was looking for.
I have to download 2017 so it'll be a bit, but I'll get it updated for you. Can't give an ETA till I see what's the matter with it, but I wouldn't expect it to take more than a day.
When I click the button to use fastest performance, I see only 19 "setpass" calls, with only 8 setpass calls if I disable the water. But if I click the highest quality button and move closer, it jumps up to over a thousand setpass calls. I have the "Main Camera" set to deferred rendering, and I set the _LushLODTreesManager to use deferred rendering... other than that, it's a fresh install and I changed nothing else. Although I do see other problems related to the 2017 version of unity which I'll get to work on fixing, but I don't see any issues with batching or speed for that matter, it seems to be as fast as it was before.
When you say it's doing so many draw calls, where are you seeing this information? Your screenshot doesn't show the draw call information you're seeing.
One test you could run, is after you click the "best performance" button, then you can search your Hierarchy for LOD_0 and select them all, and confirm that the mesh renderer is disabled on all of them. LOD_0 is the high quality tree models... and their mesh renderers should all be disabled if only the billboards are being displayed. If their mesh renderers are enabled, then some kind of error is occurring, and that would also explain the high draw calls.
I'm getting my info from the profiler. You know it could be a quirk of the profiler. I know setpass calls are supposedly draw calls now, but the profiler is not consistent there if that's completely accurate. Because in forward setpass = drawcalls but in deferred that is not the case.
Ah, I didn't know that about the setpass being a forward thing. Well you could run a test and see if you set the camera to deferred, but leave the manager in forward. That will cause the trees to continue to use the forward shaders, and basically the trees won't do anything different at all.... and see if the draw calls still go up.
Also you could try setting the manager to deferred, but leave the camera in forward... which would make the trees switch to my custom deferred shaders (even though the camera is rendering in forward)... and see if the draw calls go up in that case.
Either of those things will result in the trees probably not rendering or transitioning correctly, so I don't recommend you actually keep it that way, but just as a test to see what happens with the draw calls. If you set camera to deferred, and manager to forward, and the draw calls go up high... then there is a high probability that the issue is something on Unity's end, because my trees in that case would be using the same settings and same forward shaders... only thing different in that case would be the camera being set to deferred, which is something on Unity's end.
But if you set the manager to deferred, and camera to forward, and the draw calls are high then definitely the issue is entirely something wrong with my deferred shaders (my fault).
This of course is assuming that when my trees are set to forward, and the camera is also set to forward, that the draw calls are much lower.
Anyway, I do see some horrible rendering problems in the trees in Unity 2017, I'm surprised they look as good as they do on your computer because they look like rubbish on mine, so I'm also looking into that now.
Oops nevermind, I'm dumb, I had forgotten to click "Apply" after changing the manager to deferred. That fixed the trees looking like rubbish. Of course, I still see the setpass calls being low even if deferred. One thing though, I'm using a very low end laptop and my frame rate is exact 18 frames with every billboard in the demo scene visible on my screen, and that's for deferred. And for forward, it's 18-19 frames per second, almost identical. So I can't imagine it's got a difference of 1000+ draw calls, if the frame rate is coming up almost exactly the same. Are you able to see your exact frames per second? Or is it stuck at exactly 60 frames per second... I know some users have told me the demo won't go over 60 frames per second and I haven't figured out how to tell Unity to remove the frame rate limit.
So good here means setpass = draw calls = batches.
Bad means setpass is low but draw cals and batches are high (and both the same)
manager forward cam deferred = good
manager deferred cam deferred = bad
manager deferred cam forward = good
manager forward cam forward = good
I was able to reproduce it on my end, I see the high draw calls now. Lemme see if I can figure out why. EDIT: and it does reduce my frame rates when the draw calls are high like that, so it's not just a glitch in the profiler. So disregard my previous comment about frame rates not being affected.
So I don't think there is any actual performance difference between good/bad above. Looking closer I see that in forward it's showing the draw calls as batched into one batch. In deferred it doesn't show them as batched draw calls, but I don't see any difference in framerate or in the CPU profiler between the two. I think this is just a quirk of how the profiler shows stuff. There might be some actual differences, but they don't appear to be differences that effect anything. At least not on PC.
hmm ok so maybe I spoke too soon, or maybe my system is just high end enough where it's hard to notice the performance difference.
On my low end laptop I saw it drop from 21 FPS to 13 FPS when I switch to deferred manager, deferred camera and the setpass calls jump up over 7k... so seems to be a real issue and not just the profiler. I'm checking some things to see if I can isolate the cause. Thanks for reporting this by the way. :)
Alright I may have a fix that might work... I updated just the billboard shader that's used on the lowest quality setting (like when you click the "highest performance" button). Here's the updated shader: https://drive.google.com/file/d/0B4P0TMlg5whuNFphTEFRN0I2bVU/view?usp=sharing
If you can, please create a backup of your LushLOD Trees/Internal Files/Shaders folder, in case you need to undo the changes we're about to make.
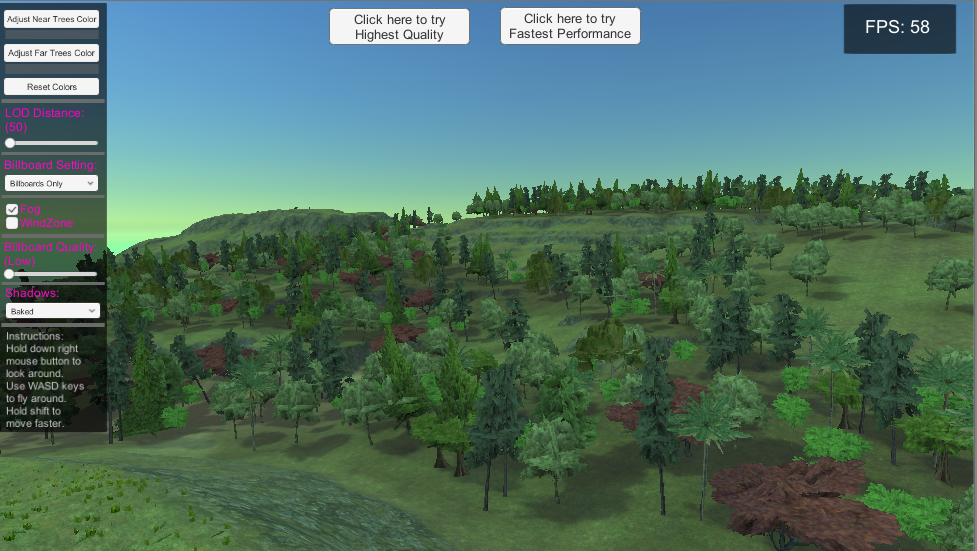
And then before you copy the updated shader into your project, run the demo first... and set the camera to deferred, and the manager to deferred, and click the highest performance button, and get a good view of the trees, and take a screenshot so you know exactly what they looked like.
Then, without moving the camera at all, with the game still running, copy the shader from the above link into the LushLOD Trees/Internal Files/Shaders/Resources folder. And go back to the game, and click the Game tab to be sure Unity has focus, and it should instantly update to use the new shader (no need to restart the game). You should see absolutely nothing change in appearance or color of the trees, except the draw calls should drop back down to normal instead of being 1000+. And then take another screenshot.
Main thing to look for in terms of differences between the two screenshots is any change in the color of the trees. In the updated shader, I had to completely rework the lighting method in the shader but I think I got it looking identical to the way it looked before, so you should see no difference except the draw calls dropping.
If it looks and works great for you, then I'll go ahead and update the rest of the deferred shaders (for each of the quality settings), but I'll wait to hear from you before I go and do all of that.
ya that definitely fixes the draw call/batching numbers. Honestly I can't really tell before from after, you probably know more about what to look for specifically. It looks fine to me.
Before:
After:
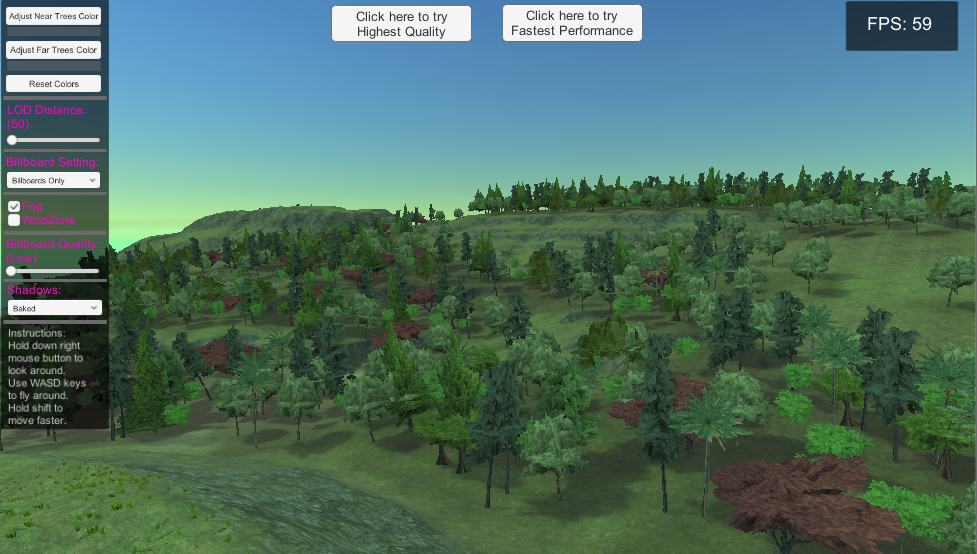
Looks fine to me :)
I'll get to work updating the rest of the deferred shaders then...
One other option you might want to add is being able to toggle blend probes in the manager. I had a bare scene that worked great but my game scene was still seeing high draw calls/batches. It stemmed from having a light probe group.
Yea, normally you don't directly edit the trees and you're supposed to use the manager for everything, but in the case of blend probes it is perfectly safe to search the hierarchy for LOD_0 or LOD_1, select them all, and modify the blend probe setting. It won't mess anything up to edit the blend probes.
Here's a link to download a zip file containing all the updated deferred shaders, and the draw calls should be fixed: https://drive.google.com/file/d/0B4P0TMlg5whueWxacndwc3NHNkE/view?usp=sharing
I will be submitting version 0.76 to the Asset Store which will contain this fix.
If you see any further problems relating to this issue, please let me know.
Customer support service by UserEcho

Here's a link to download a zip file containing all the updated deferred shaders, and the draw calls should be fixed: https://drive.google.com/file/d/0B4P0TMlg5whueWxacndwc3NHNkE/view?usp=sharing
I will be submitting version 0.76 to the Asset Store which will contain this fix.
If you see any further problems relating to this issue, please let me know.